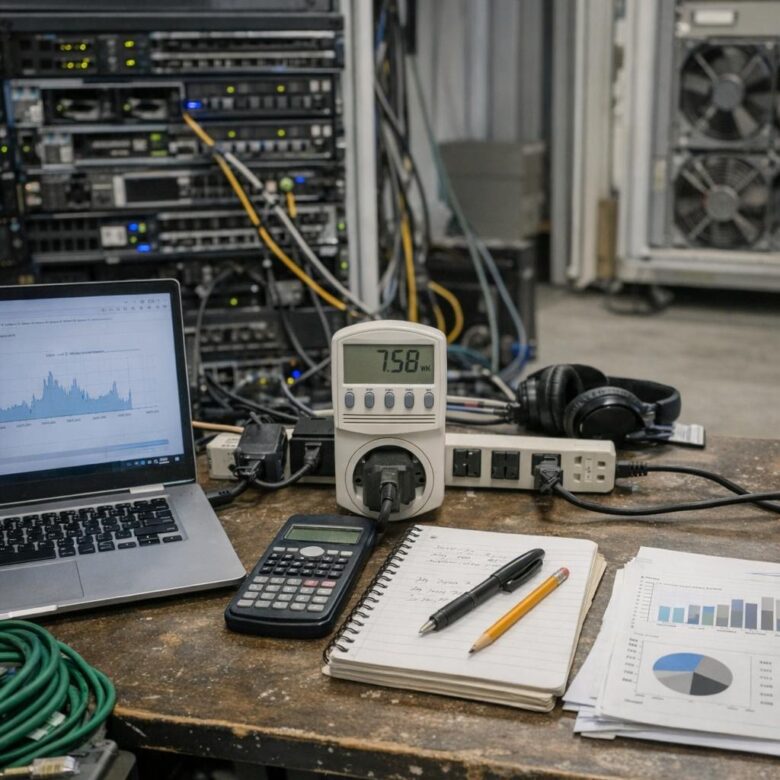
Buying GPU servers is only the beginning of an on-premise large language model budget. The real cost also includes electricity, cooling, storage, networking, software support, security, skilled staff, spare capacity, maintenance, and the cost of hardware that may remain underused.
A useful financial model must connect these expenses to actual workload demand. That means measuring not only what the infrastructure costs, but also how many reliable and useful outputs it produces.
On-premise LLM infrastructure becomes financially attractive only when the organization can maintain enough useful utilization to spread fixed costs across a large, predictable workload. Purchasing powerful hardware without a verified demand profile often produces a high cost per useful output.
Self-hosting a large language model can provide greater control over infrastructure, deployment schedules, data flows, model versions, and network boundaries. It can also reduce dependence on usage-based external services.
However, on-premise deployment does not automatically guarantee lower costs, stronger privacy, or better performance. Those outcomes depend on architecture, utilization, operational maturity, security controls, staffing, and the suitability of the selected model.
The Cost Is Larger Than the Server Quote
A vendor quotation usually shows the most visible capital expense. It may not fully represent the cost of installing, operating, supporting, and eventually replacing the system.
Hardware and installation
GPU servers, CPUs, system memory, storage, networking, racks, power distribution, installation, warranties, spare parts, and deployment services.
Continuous operations
Electricity, cooling, data-center space, software support, monitoring, backups, security operations, maintenance, incident response, and technical staff.
Useful output economics
Cost per request, successful task, document processed, active user, million tokens, or another outcome that reflects real business use.
Interactive On-Premise LLM Cost Calculator
Use the calculator below to create an initial annualized estimate. Keep all monetary inputs in the selected currency and replace the illustrative defaults with verified quotations, measured power data, employment costs, and expected production volumes.
LLM Infrastructure TCO Estimator
This tool annualizes the hardware purchase and adds energy, operational, staffing, maintenance, and resilience costs.
The calculator is an educational planning tool. It does not include financing costs, taxes, import duties, model-development costs, application integration, legal review, or the economic impact of downtime unless you include them in the input fields.
How the Calculator Treats Power and Cooling
Server power is only the energy consumed by the IT equipment. A data center also uses energy for cooling, power conversion, lighting, pumps, fans, and other supporting systems.
Power Usage Effectiveness, commonly called PUE, compares total facility energy with IT equipment energy. A PUE of 1.50 means that every unit of IT energy is associated with approximately 0.50 additional units of facility overhead.
Do not add cooling twice
If your PUE already includes facility overhead, do not separately add another percentage for the same cooling electricity. Separate facility fees may still apply for rack space, maintenance, water, or colocation services.
Define the Workload Before Selecting Hardware
Cost estimation should begin with the service the organization needs to provide, not with a preferred GPU model. Hardware sizing becomes more reliable when the team can describe expected traffic and performance requirements.
Document search, customer support, code assistance, classification, extraction, summarization, and autonomous workflows can have very different model and latency requirements.
Record expected active users, peak concurrent requests, prompt length, output length, operating hours, seasonal demand, and acceptable queue time.
Define time to first token, total response time, throughput, uptime, recovery objectives, and the percentage of requests that must meet the target.
Compare candidate models using representative business data. A larger model is not automatically more economical or more reliable for a narrow enterprise task.
Test precision, quantization, context length, batch settings, cache behavior, concurrency, retrieval, and safety controls on the intended hardware.
Count outputs that meet quality, security, latency, and availability requirements. Raw token speed alone does not show whether the system creates business value.
Cost Categories Often Missing From Early Budgets
| Cost Category | What to Include | Why It Is Commonly Missed |
|---|---|---|
| GPU compute | Accelerators, host CPUs, memory, baseboards, chassis, power supplies, warranties, and spare capacity. | The purchase quote may be treated as the complete project cost. |
| Storage | Model weights, datasets, vector indexes, logs, checkpoints, backups, snapshots, and retention growth. | Initial storage may appear sufficient before production logging and duplicate model versions accumulate. |
| Networking | High-speed internal networking, switches, cabling, firewalls, load balancers, remote access, and data transfer. | Teams focus on GPU specifications while underestimating movement of models, embeddings, and application traffic. |
| Power and cooling | IT electricity, cooling overhead, UPS losses, rack power, metering, and facility capacity. | Budgets may use server power alone and ignore facility overhead. |
| Software | Operating systems, enterprise AI platforms, orchestration, security, observability, backup, support, and management tools. | Open-source serving software may still require internal support and surrounding commercial services. |
| Staffing | ML engineering, platform engineering, DevOps, SRE, security, networking, data engineering, testing, and user support. | Existing employees may be treated as free capacity even when the deployment consumes substantial time. |
| Integration | Identity, applications, APIs, retrieval pipelines, enterprise data, permissions, testing, and change management. | The model server may be mistaken for the complete business solution. |
| Resilience | Redundant components, failover, backups, recovery testing, spare GPUs, and excess peak capacity. | A laboratory deployment may work on one server, while a production service requires continuity. |
| Governance and risk | Access reviews, audit logging, model evaluation, privacy review, incident response, and policy enforcement. | These activities may be assigned to other departments and excluded from the AI budget. |
| Refresh and retirement | Migration, secure data removal, disposal, replacement planning, software upgrades, and compatibility work. | The financial model often ends at deployment rather than at the end of the system lifecycle. |
Why Utilization Changes the Result
Most on-premise expenses continue even when the GPUs are not processing useful work. Hardware depreciates, support contracts remain active, racks occupy space, monitoring continues, and staff remain responsible for the environment.
Consider two systems with the same annual TCO. If one produces four times as many acceptable outputs, its unit cost can be approximately four times lower. This is why utilization and workload design matter as much as acquisition price.
Token-based costing is helpful for comparing model-serving configurations, but it should not be the only business metric. A shorter, accurate output may deliver more value than a longer response. For some projects, cost per document, resolved case, completed workflow, or active employee may be more meaningful.
Optimization Levers That Can Reduce Unit Cost
Right-size the model
Test whether a smaller specialized model, retrieval-assisted model, or task-specific pipeline can meet the requirement before committing to a larger model.
Evaluate quantization
Lower-precision deployment can reduce model memory requirements, but quality and hardware compatibility should be measured using representative data.
Tune request batching
Compatible requests may be grouped to improve throughput, provided that the additional queue delay remains within the required latency target.
Reuse repeated prompt work
Prefix caching can avoid recomputing shared prompt sections when requests repeatedly use the same instructions, document, or conversation prefix.
Route workloads intelligently
Use different models or service tiers for simple and complex requests instead of sending every task to the most expensive model.
Measure GPU behavior
Track utilization, memory, power, temperature, errors, throughput, queue time, and failed requests before purchasing additional capacity.
Optimization can create trade-offs
Quantization may affect output quality, batching may increase latency, aggressive caching may complicate data isolation, and high utilization may reduce capacity available during failures. Every optimization should be tested against service, security, and recovery requirements.
On-Premise, Cloud, or Hybrid?
The correct option depends on demand, data requirements, existing facilities, staffing, procurement speed, and how quickly the workload may change.
| Factor | On-Premise | Cloud Service | Hybrid |
|---|---|---|---|
| Initial commitment | Higher capital and implementation commitment. | Lower infrastructure commitment for an initial pilot. | Moderate, depending on which workloads remain internal. |
| Cost behavior | More fixed cost, with unit economics improving when useful utilization is high. | More usage-driven cost, which can suit uncertain or variable demand. | Fixed baseline capacity combined with elastic external capacity. |
| Deployment speed | Procurement, facility preparation, installation, and validation may take time. | Capacity may be available more quickly when the required service and region are supported. | Can accelerate pilots while preserving an internal path for selected workloads. |
| Operational responsibility | The organization manages the complete infrastructure lifecycle. | The provider manages more infrastructure, while the customer still manages application, data, access, and governance decisions. | Responsibility is split and may require more complex architecture. |
| Capacity flexibility | Limited by purchased equipment and available facility power. | Can offer greater elasticity, subject to quotas, availability, and pricing. | Can reserve internal capacity for predictable demand and use external capacity for peaks. |
| Data control | Offers direct control over infrastructure and network boundaries when correctly designed. | Depends on provider terms, architecture, region, encryption, and service configuration. | Allows workloads to be separated according to sensitivity and operational need. |
| Technology refresh | The organization bears migration and hardware-obsolescence risk. | The provider introduces new capacity, but customers may still need application changes. | Can reduce dependence on one infrastructure path while increasing management complexity. |
When On-Premise Can Make Sense
- Workload demand is large and relatively predictable
- The organization already operates suitable data-center capacity
- Internal teams can manage GPU infrastructure reliably
- Data-location or network-boundary requirements are important
- Models must operate in an isolated or restricted environment
- Production utilization can be measured and maintained
- The organization has a realistic refresh and support plan
- A multi-year comparison shows credible unit-cost benefits
Warning Signs That the Business Case Is Weak
- No verified forecast for requests, users, or token volume
- Hardware is selected before models are benchmarked
- The budget excludes staffing and integration work
- The project assumes GPUs will remain fully utilized
- No one owns monitoring, patching, or incident response
- The system has no tested recovery or failover plan
- Privacy is assumed without a documented security design
- The financial comparison ignores technology refresh
Questions to Ask Before Approving the Purchase
- Which business tasks will the infrastructure support during its first year?
- What production data was used to benchmark the selected model?
- What are the required latency, throughput, uptime, and recovery targets?
- How much GPU memory is required at the selected precision and context length?
- What average and peak concurrency must the serving system support?
- What percentage of purchased capacity is expected to produce useful work?
- Does the facility have sufficient power, cooling, rack, and network capacity?
- Which team will monitor, patch, secure, and support the environment?
- Which software, support, and model-license terms apply?
- How will the organization measure cost per useful output?
- What happens when demand exceeds internal capacity?
- How will the infrastructure be refreshed, migrated, or retired?
A Better Evaluation Process
Instead of beginning with a large production purchase, organizations can reduce uncertainty through staged testing.
Use real prompts, documents, expected context lengths, output lengths, concurrency, and quality requirements.
Compare quality, latency, throughput, memory use, and operational complexity rather than assuming that the largest model is necessary.
Collect power, utilization, queue, cache, error, token, and user-adoption data over a representative period.
Model conservative, expected, and peak demand instead of relying on one optimistic forecast.
An on-premise system with failover and staffed support should be compared with a cloud option offering a similar availability and support level.
Expand only after measured demand, utilization, quality, and operational performance justify the next investment.
Final Perspective
The financial value of an on-premise LLM is not determined by the number of GPUs, model parameters, or benchmark headlines. It is determined by whether the complete system can deliver reliable business outputs at a sustainable unit cost.
A strong business case includes the entire lifecycle: acquisition, installation, power, cooling, software, storage, networking, staffing, security, monitoring, resilience, maintenance, upgrades, and retirement.
It also recognizes that fixed infrastructure becomes expensive when demand is uncertain or utilization is low. For some organizations, cloud services provide a safer starting point. Others may benefit from a hybrid design or from owning capacity for stable, sensitive, and high-volume workloads.
The most defensible decision comes from measured production assumptions rather than a vendor quote alone.
For related implementation planning, read Senawe’s guide to integrating AI chatbots with legacy enterprise resource planning software .
Frequently Asked Questions
Is running an LLM on-premise always cheaper than using an API?
No. On-premise infrastructure can produce favorable unit costs when demand is high, stable, and efficiently served. It can be more expensive when hardware is underused, staffing is limited, or the workload changes before the investment is recovered.
Should hardware cost be divided by three, four, or five years?
Use the useful life accepted by the organization’s finance and infrastructure teams. Consider expected performance needs, support coverage, component availability, model growth, and the risk that the hardware becomes unsuitable before it physically fails.
What is the difference between server power and PUE-adjusted power?
Server power represents the IT equipment. PUE-adjusted power also accounts for facility energy used to support that equipment, including cooling and power-delivery overhead.
Does quantization always reduce cost?
It can reduce memory requirements and may improve serving economics, but results depend on the model, format, hardware, serving engine, and quality requirements. The quantized model should be evaluated with representative business tasks before production use.
What utilization level makes on-premise worthwhile?
There is no universal threshold. The answer depends on acquisition price, energy, staffing, facility overhead, workload value, required spare capacity, and the cost of comparable alternatives. Calculate unit cost across several realistic demand scenarios.
Should training and inference use the same cost model?
They should usually be separated. Training, fine-tuning, evaluation, batch processing, and interactive inference can have different utilization patterns, hardware requirements, service targets, and operating schedules.
Official Sources and Further Reading
- NVIDIA DGX H100 and H200 System Documentation
- NVIDIA Data Center GPU Manager Documentation
- NVIDIA DCGM Exporter GPU Telemetry
- NVIDIA Triton Inference Server: Dynamic Batching
- vLLM Quantization Documentation
- vLLM Automatic Prefix Caching
- U.S. Department of Energy: Data Center PUE and Cooling Efficiency
Editorial note: This article provides general educational information and an illustrative planning calculator. Hardware prices, energy rates, software terms, model licenses, technical specifications, and organizational requirements change over time. Verify important assumptions with current vendor documentation, measured workload data, qualified infrastructure professionals, and the appropriate financial, security, privacy, and legal teams.

The Senawe Editorial Team creates practical, research-based content about enterprise AI, robotic process automation, data analytics, digital transformation, and emerging business technologies. Our goal is to make complex technical topics easier to understand while helping professionals evaluate tools, strategies, risks, and implementation decisions with greater confidence.